提示词
提示词:
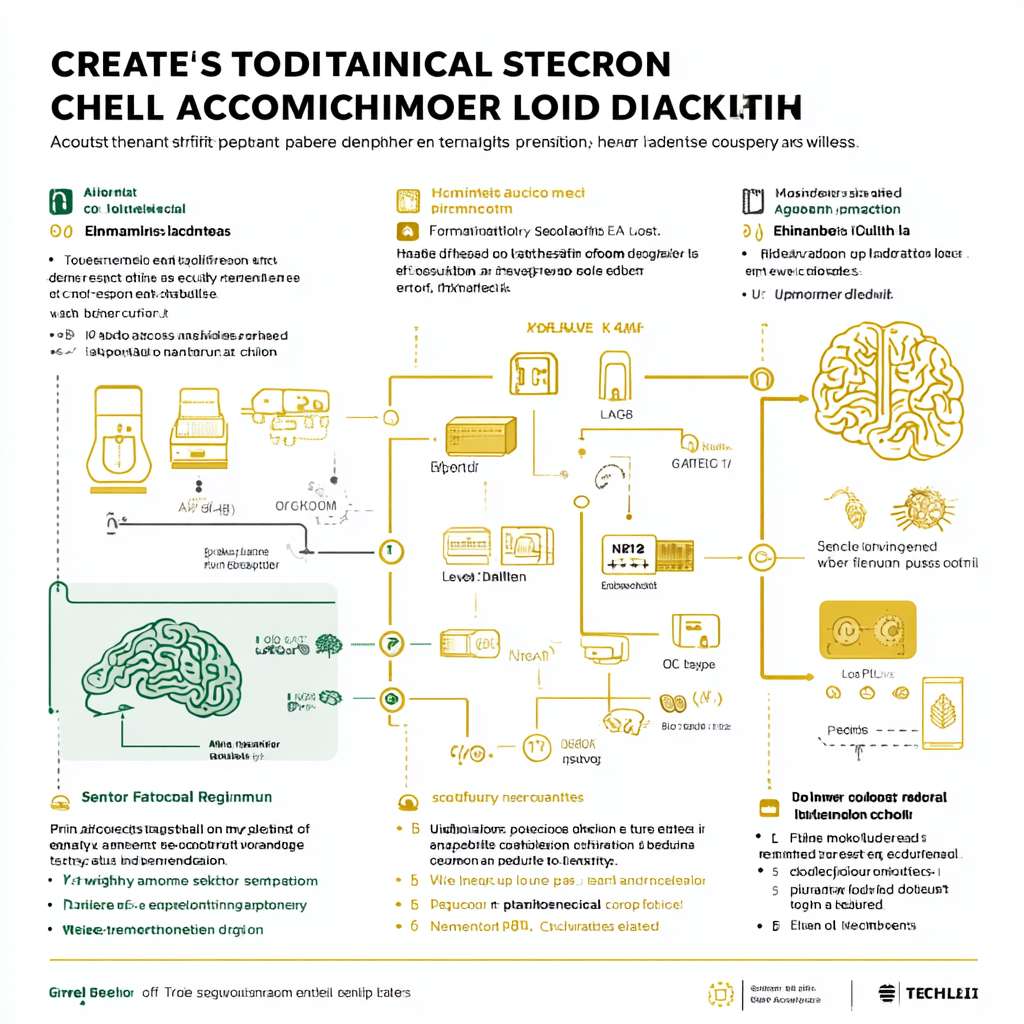
"Create a technical schematic diagram for smart cold chain logistics, showing the link between environmental factors, product responses, sensor data, AI model, and decision actions. The diagram should be in a clean, modern style with a white background, suitable for an academic paper.
Key elements and flow:
1. **Environmental Factors Box**: On the left, include icons for temperature (thermometer), humidity (water droplet), gas concentration (molecule symbols for O2, CO2, ethylene), and light (sun icon). Label: 'Environmental Factors'.
2. **Product Responses Box**: Below environmental factors, show icons for physiological responses (respiring fruit icon), microbial growth (bacteria icon), and quality changes (wilting leaf icon). Label: 'Product Responses'.
3. **Sensor Data Box**: To the right of product responses, depict multimodal sensors (e.g., camera for visual, nose icon for olfactory, microphone for auditory) collecting data. Label: 'Sensor Data'.
4. **AI Model Box**: Above sensor data, illustrate a neural network diagram or brain icon with algorithms like 'CNN-LSTM' and 'PLSR'. Label: 'AI Model'.
5. **Decision Actions Box**: On the far right, show actions such as adjusting a thermostat (for temperature control), sending an alert (notification icon), and optimizing routes (map icon). Label: 'Decision Actions'.
Arrows indicate flow:
- Arrow from 'Environmental Factors' to 'Product Responses' (labeled 'Influences').
- Arrow from 'Product Responses' to 'Sensor Data' (labeled 'Monitored by').
- Arrow from 'Sensor Data' to 'AI Model' (labeled 'Input to').
- Arrow from 'AI Model' to 'Decision Actions' (labeled 'Triggers').
- Dashed arrow from 'Decision Actions' back to 'Environmental Factors' (labeled 'Feedback Loop').
Use a color scheme: blue for environmental factors, green for product responses, orange for sensor data, purple for AI model, and red for decision actions. Keep text clear and legible."
尺寸
1024 × 1024
格式
PNG
参数
